Stroke rate
It often happens that when we watch professional swimmers, we get the impression that they are completing lengths with very few strokes. This is misleading, especially when we want to imitate them, because most people do not realize that they do take fewer strokes per length than we do, but they do not pay attention to the speed at which they swim, which is higher than us swim.
Neither we usually take into account their size, their height, their technique, their strength, much less do we think about the degree of sensitivity to water that they have and we do not. We leave out many important variables and only stay in appearance.
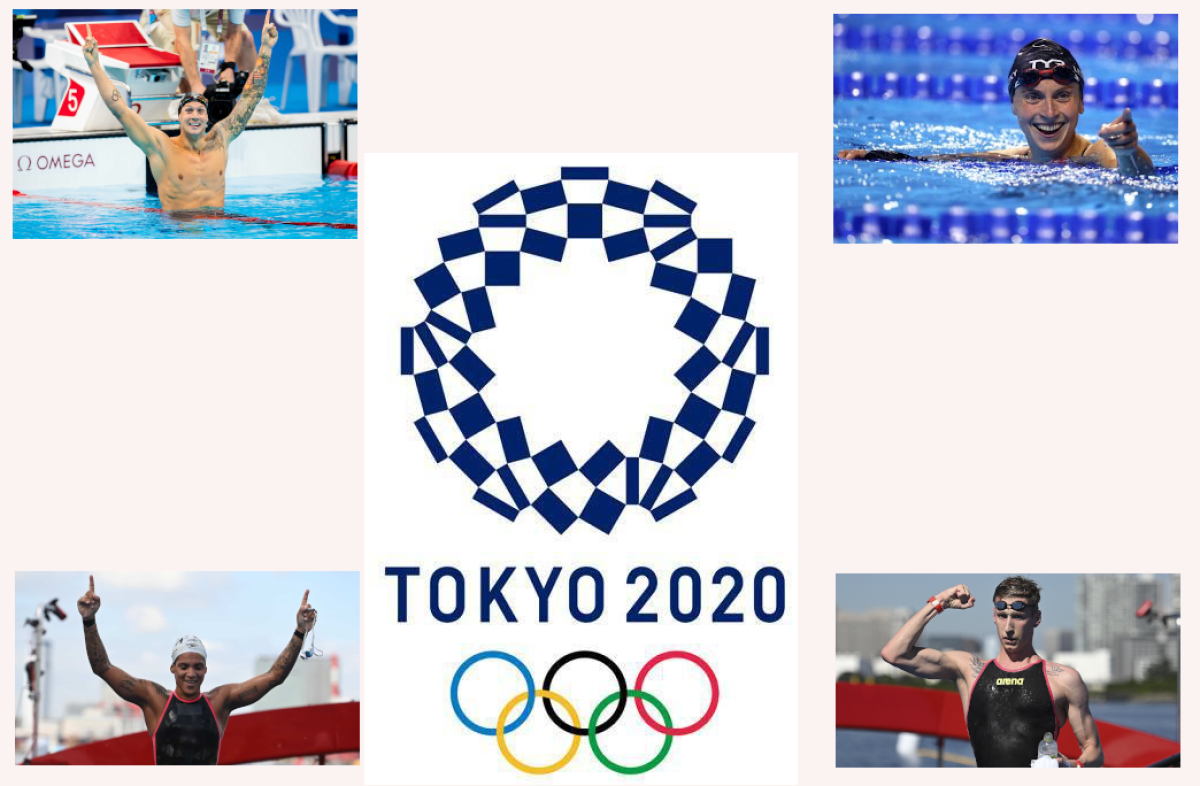
For example, the average height of the champions of the crawl events (50m, 100m, 200m, 400m, 800m, 1500m, 10k, and triathlon) in the recent Olympic Games Tokyo 2020 was: 186cm the boys , and 176 cm the girls. These values are far from the average height of amateur swimmers.
If we want to imitate these portents and wanting to swim taking a few strokes per length without realizing how slow we are, generate many errors: over gliding, swimming with stop and starts without thinking about the density of the water, raising your hands at the entrance generating a brake, push the water down instead of backwards, increase the beat because you are not pulling with the arms and therefore generating more fatigue, etc.
Next I show you a table with the winners of the crawl races at the Olympic Games, with the approximate calculation of their swim cycles per minute in different parts of the race, the average cycles per minute, final time, and average swimming pace at 100m.
| 50m crawl | ||||||
| Swimmer | Height | Cycles 20m | Cycles 30m | Cycles 40m | Average Cycles | Final Time |
| Caeleb Dressel | 191 cm | 65 | 65 | 65 | 65 | 21.07 |
| Emma Mckeon | 180 cm | 60 | 60 | 60 | 60 | 23.81 |
| 100m crawl | |||||||
| Swimmer | Height | Cycles 40m | Cycles 70m | Cycles 90m | Average Cycles | Final Time | Swimming Pace 100m |
| Caeleb Dressel | 191 cm | 50 | 50 | 60 | 53 | 47.02 | 47.02 |
| Emma Mckeon | 180 cm | 50 | 50 | 50 | 50 | 51.96 | 51.96 |
| 200m crawl | ||||||||
| Swimmer | Height | Cycles 50m | Cycles 100m | Cycles 150m | Cycles 200m | Average Cycles | Final Time | Swimming Pace 100m |
| Tom Dean | 194 cm | 40 | 40 | 40 | 42 | 40.5 | 1:44.22 | 52.11 |
| A Titmus | 177 cm | 48 | 48 | 48 | 48 | 48 | 1:53.50 | 56.75 |
| 400m crawl | ||||||||
| Swimmer | Height | Cycles 100m | Cycles 200m | Cycles 300m | Cycles 400m | Average Cycles | Final Time | Swimming Pace 100m |
| A Hafnaoui | 178 cm | 40 | 40 | 42 | 44 | 41.5 | 3:43.36 | 55.84 |
| A Titmus | 177 cm | 43 | 43 | 43 | 47 | 44 | 3:56.69 | 59.17 |
| 800m crawl | |||||||
| Swimmer | Height | Cycles 200m | Cycles 400m | Cycles 800m | Average Cycles | Final Time | Swimming Pace 100m |
| Robert Finke | 185 cm | 38 | 38 | 45 | 40 | 7:41.07 | 57,63 |
| K Ledecky | 183 cm | 45 | 45 | 45 | 45 | 8:12.57 | 01:01.57 |
| 1500m crawl | |||||||
| Swimmer | Height | Cycles 500m | Cycles 1000m | Cycles 1500m | Average Cycles | Final Time | Swimming Pace 100m |
| Robert Finke | 185 cm | 37 | 37 | 45 | 39.5 | 14:39.65 | 58,64 |
| K Ledecky | 183 cm | 43 | 41 | 43 | 42 | 15:37.34 | 01:02,48 |
| 10 k | ||||
| Swimmer | Height | Cycles Last KM | Final Time | Swimming Pace 100m |
| F Wellbrock | 192 cm | 38 | 1:48:33.7 | 1:05,13 |
| A.M. Cunha | 163 cm | 47 | 1:59:30.8 | 01:11,70 |
| Triathlon 1500m | ||||||
| Swimmer | Height | Lap 1 | Lap 2 | Average Cycles | Final Time | Swimming Pace 100m |
| V Luis | 177 cm | 37 | 40 | 38.5 | 17:39 | 01:10,60 |
| J Learmonth | 168 cm | 45 | 45 | 45 | 18:24,00 | 01:13 |
If you prefer to count the strokes, you can multiply the cycles by two to know the strokes per minute that the swimmers are doing in the different chosen parts of the races.
As advice and to be aware of what w are trying in this post, it would be perfect if you tried to swim 25 or 50m at those frequencies strokes using a metronome.
And yes, they give fewer strokes per length than us, but swimming much faster, having a stroke rate much higher than we can bear, and above all because they catch much more water by applying much more strength than we are, and not because of OVERGLIDING, which is what happens to us when we want to imitate them.
In conclusion, we must adapt the ideal swimming pattern to our characteristics, and not the other way around. It would be good to take a frequency stroke test to see which is the best fit to our characteristics and sensations.
